What is Process Capability?
When you are deciding on whether you should buy a certain product, what questions run through your mind? Does this product meet the conditions I have? Will it still be functional X months/years from now? Will I be able to buy a replacement that performs as well as it does now in the future? Certainly, as a customer, you want to be assured that your purchase will not be a waste of money and that you can potentially stay loyal to one brand or company. As a manufacturer, you want to ensure that you can satisfy your customers’ demand while maintaining a time- and cost-efficient process.
Well, you’re in luck! Today, we have statistical tools as our best friend. With their help, manufacturers and other business establishments can ensure that their product or service meets your expectations now and in the future. We can thank Walter A. Shewhart for his findings about variations in processes and for the creation of control charts, one of the most fundamental statistical tools in quality control, in the 1920s. These are used to assess the quality of a process and determine if it is capable. But, how is this done?
What is Capability?
First, let’s start with the basics. The capability of a process refers to its ability to meet customer requirements or specifications. Capability statistics are calculated and analyzed to verify whether the process is capable. However, before a conclusion can be made, the following conditions must be satisfied:
-
The process must be stable.
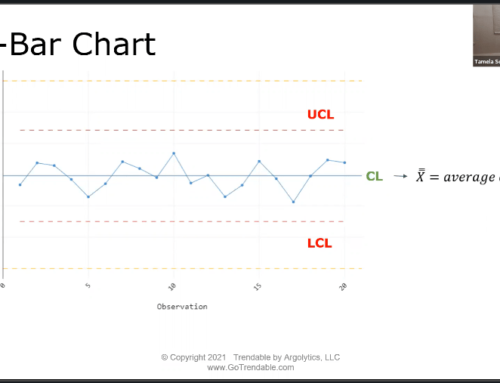
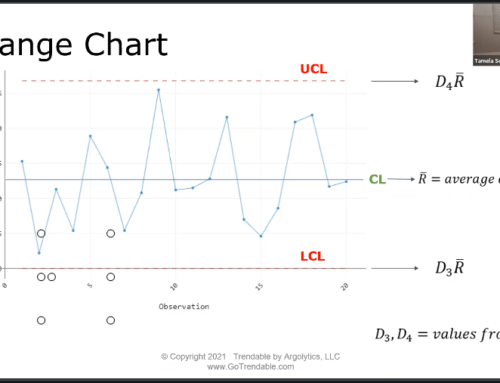
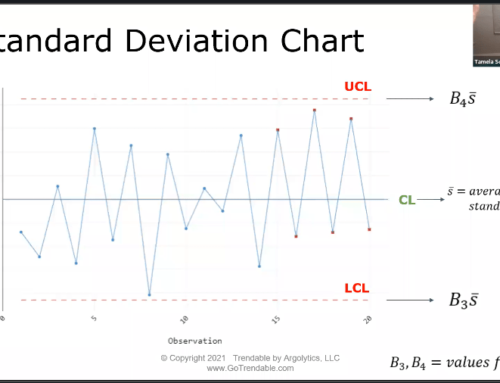
- If the process is unstable, that means there may be special causes of variation (i.e. unnatural variation) and the capability analysis results will, therefore, be invalid. Process stability can be verified with a control chart.
-
The data must fit the chosen distribution.
- The standard capability analysis can only be used if the data is normally distributed, which can be verified with a probability plot or histogram. Non-normal capability analysis is performed on data with a non-normal distribution.
-
There must be a sufficient amount of data.
-
- Like other research methods, a capability analysis requires a sample size that is representative of the observed process. Thus, it requires a large sample size (typically at least 100 observations) that is recorded over a period of time to reduce uncertainty of the data.
Capability Statistics and Analysis
In a capability analysis, there are two main metrics to consider: short-term capability (Cp and Cpk) and overall capability (Pp and Ppk).
Short-term capability suggests how well a process can potentially meet the customer specifications, while overall capability informs how well the process performed over a period of time. The process is said to be stable and capable when the Cp and Pp values are almost equal, and 99.99% of all observations are within the upper and lower specification limits if these metrics are at least 1.33. Therefore, the desirable process must be able to meet both conditions.
Capability Trends
It is easy to conclude that the process will be able to provide items or services of the same quality over time just by looking at these statistics. But how can we predict if it actually would maintain its quality in a longer period of time? Here’s where TRENDABLE™’s Key Trends feature comes in handy to generate long-term capability plots. Let’s look at two examples:
Example 1: Piston Ring Diameter
A manufacturer is requested to produce piston rings with a diameter between 73.97 mm and 74.03 mm. The capability analysis is conducted with 125 piston ring diameters recorded. The figure below illustrates the control chart of this process.

Looking at the control chart, the process can be said to be stable as all data points are within the specification limits. The capability metrics are calculated to be Cpk = 1.501 and Ppk = 1.448 which is a great sign because these values are above 1.33. To check whether the stability of the process can be maintained in the long run, its long-term capability is plotted below.

There are two key observations from the long-term capability plot: the Cpk of the process increases over time, and it increases above the Cpk target of 1.33. The manufacturer can then proceed with the existing stable and capable process. The next example will demonstrate the statistics that will be observed if the process is not capable.
Example 2: Furnace Temperature
This process involves maintaining the furnace temperature between 470℉ to 480℉. To conduct the capability analysis, the furnace temperature is observed and recorded 200 times. Below is the control chart of this process.

Similar to Example 1, all of the recorded temperatures appear to be within the specification limits, suggesting that the process is stable. The calculated Cpk of 0.718 and Ppk of 0.698 support this conclusion as they are nearly equal. However, these values are lower than 1.33. We cannot simply conclude that the process is capable just because this sample of 200 furnace temperatures satisfies the specification requirements. A long-term capability plot can depict how this issue will affect the process in the long run, as shown below:

The long-term Cpk plot of this process shows that not only is the Cpk far from the target of 1.33, it will also decrease at one point. With the statistics and graphs generated by TRENDABLE™, the manufacturer may conclude that there is an underlying issue with the process, such as a large standard deviation – in this case, a standard deviation of 2.287℉ – that must be solved first before continuing with this process. It is always best to identify and eliminate possible sources of errors during the early stages of a project as it is much more time- and cost-efficient than doing so when it is too late.
Key Takeaways
It is important to examine the capability of a product or service to ensure that it meets the customers’ expectations now and in the future. With statistical tools like TRENDABLE™, conducting capability analysis has become much easier. However, the capability of a process cannot be judged simply by observing its control chart and its capability statistics which only provide a glimpse of its stability and capability. TRENDABLE™’s Key Trends feature is very helpful in generating long-term capability plots to determine how these statistics would perform in the long-run in order to decide if the process needs any intervention before proceeding with it. Always remember: don’t wait too long to eliminate possible issues, or you will lose time and money.
Author
Michelle Soeganto is the author of this article. Learn more about the Argolytics team here.
