What is Ppk?
What is Ppk?
Ppk is a common statistical tool used to assess process capability. Ppk represents the “Overall Capability” of the process. This long-term capability can be thought of as the quality the customer experiences.
What does Ppk stand for?
P = Performance
p = process
k = katayori
Katayori is a Japanese term for deviation or offset. It references the amount of potential capability lost due to poor centering of the process.
What about Pp?
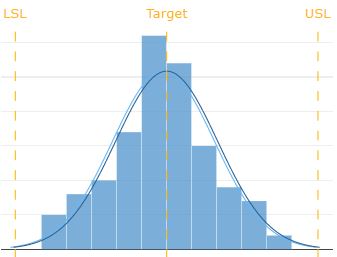
Pp is a capability index related to Ppk. Both Pp and Ppk are calculated using the standard deviation between the subgroups. The Pp statistic gives an indication of the “wide-ness” of the of the distribution over time. When the Pp is larger, the distribution of the data is tighter. In other words, there is more whitespace between the data and the customer specification limits. Learn about creating Pp and Ppk statistics in TRENDABLE with our Lesson Videos.
Pp and Ppk Interpretation
The Ppk statistic gives an indication of where the center of data distribution is relative to the customer specification limits and taking into account the range of the distribution. Ppk is a ratio of the distance between the process average and the closest specification limit.
Pp and Ppk are related and should be evaluated together. It is generally desirable to have Pp and Ppk values of at least 1.33 – the larger the better. If you have a lot of returns or warranty issues, overall Pp and Ppk statistics are too low.
How can Ppk improve?
Overall capability can be improved first by taking steps to increase within capability statistics Cp and Cpk to above 1.67. Learn more about Cp and Cpk here.
Additional steps like working with suppliers to control the significant inputs to the process should be considered. Take action to eliminate unusual events and decrease special cause variation in the process. Not only will this improve quality, it will also increase customer satisfaction and drive future revenue.


