What is an Individuals Control Chart (I-Chart)?
in TRENDABLE for Data Analysis
What is an Individuals Chart?
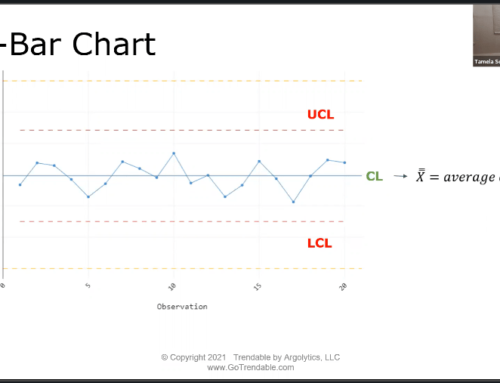
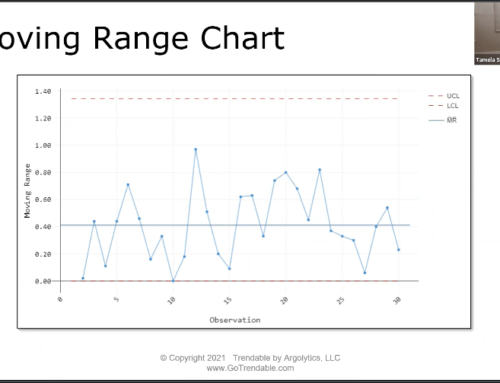
The simplest and most commonly used control chart is the Individuals or I-Chart. Each recorded observation is plotted on the chart in time order to evaluate the variation between consecutive samples. It is paired with the Moving Range MR-Chart to evaluate between observation variation. The centerline is the average of all observed values and the control limits are ±3 standard deviations from the average.
How do I make an I-Chart with TRENDABLE for Data Analysis?
- Upload your data to Trendable for Data Analysis.
- Create/Select specification limits specific to the data.*
- Review the results.
- Export the final report to Microsoft Word.
*Note: When the chosen specification limit subgroup size is 1, Trendable for Data Analysis automatically displays an Individuals Control Chart in the report.
