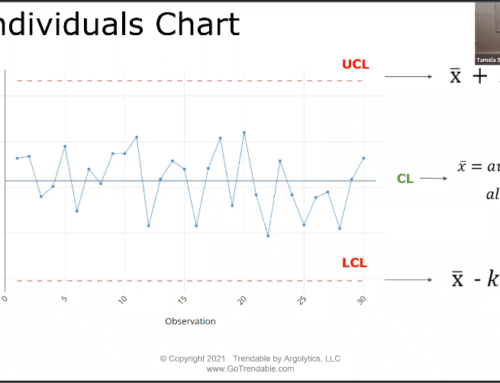
What is the Moving Range Chart (MR-Chart)?
What is a Moving Range Chart?
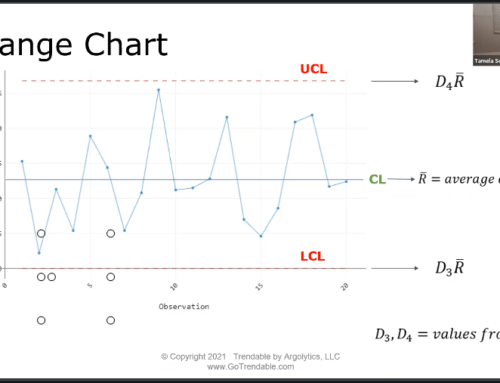
The Moving Range chart or MR-Chart helps to assess process variation by taking the absolute difference between consecutive observations. It is typically paired with the individuals (I) chart. The MR Chart is used to assess whether the variation between two consecutive data points is unnatural, and to determine the data points wherein the special-cause variation may be present. Because of that, it is important that the observations are recorded in time order. It is used when the size of the subgroup is one. The centerline is the average value of all moving ranges. The control limits are set at a distance of three standard deviations above and below the center line.
How do I make an MR-Chart with TRENDABLE for Data Analysis?
- Upload your data to Trendable for Data Analysis.
- Create/Select specification limits specific to the data.*
- Review the results.
- Select “Add Chart” and choose Range Chart.*
- Export the final report to Microsoft Word.
*Note: When the chosen specification limit subgroup size is 1, Trendable for Data Analysis automatically displays an Moving Range Chart in the report.

