Trendable for Data Analysis
Pipe Diameter
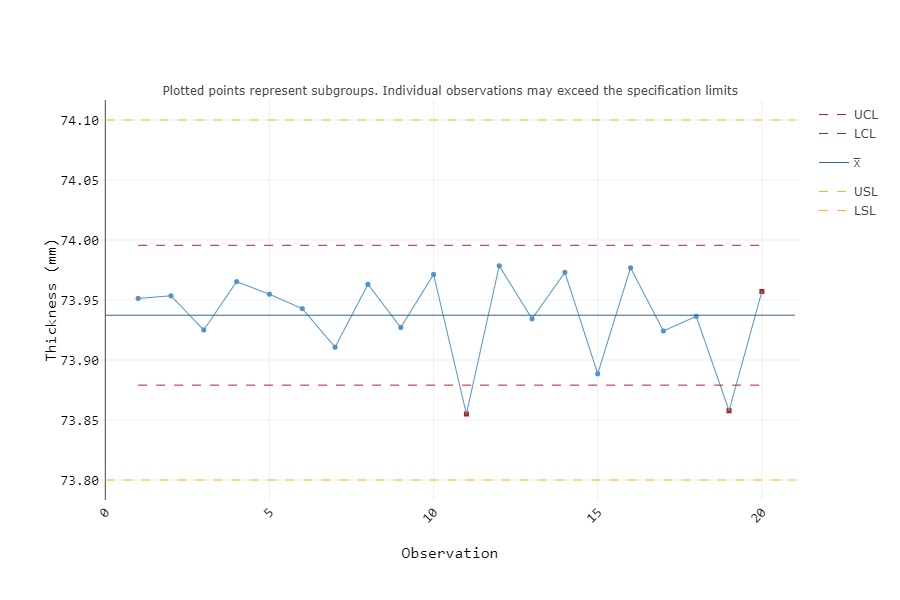
Control Chart

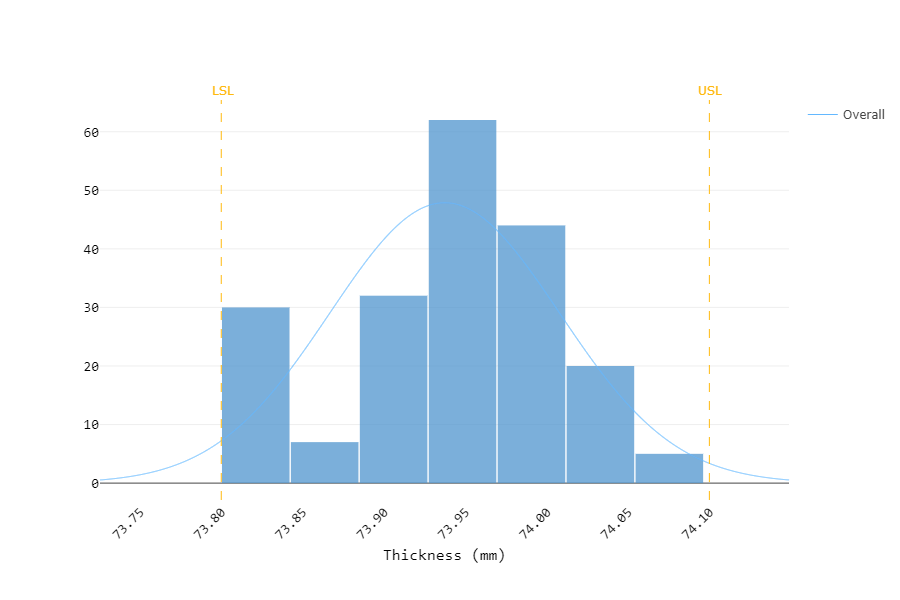
Capability Histogram

Data Scenario
A plumbing company is interested in finding out whether the process they operate to manufacture their pipes varies significantly on a daily basis. For 20 consecutive days, the diameters of 10 pipes are recorded each day to see if the average diameter of these 10 pipes fall within the specification limits of 73.8 mm and 74.1 mm. The X-Bar chart of this process suggests neither stability nor capability as there are days wherein the average is below 73.8 mm. Furthermore, the average value from the last day fails Test 4 of the eight Tests for Special Causes: fourteen consecutive points alternating up and down.
