Trendable for Data Analysis
Pharmacy Wait Time
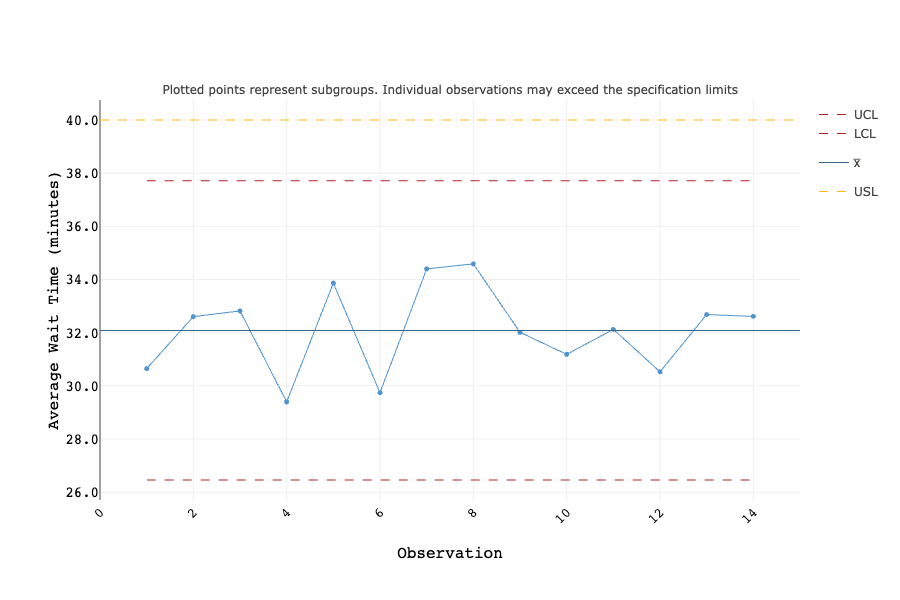
Control Chart

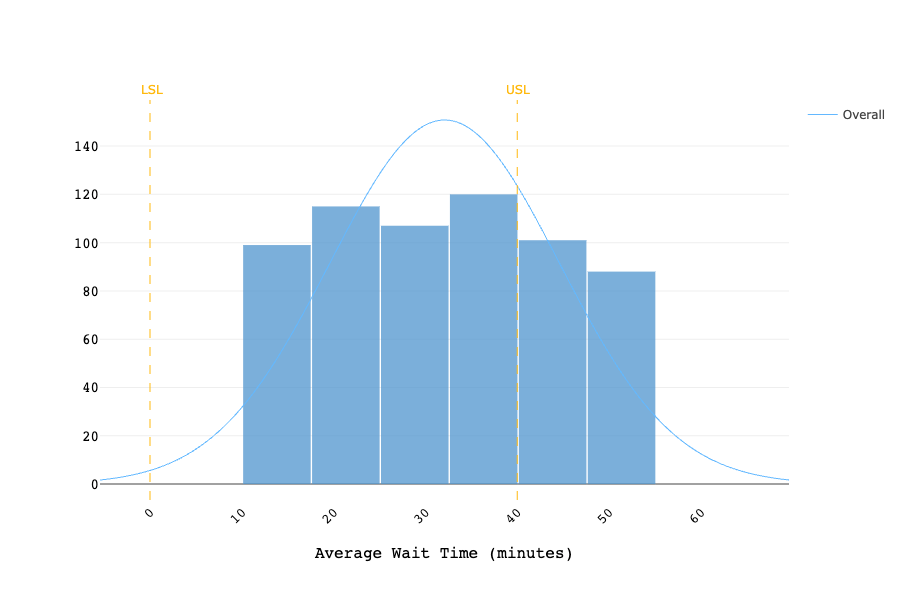
Capability Histogram

Data Scenario
A local pharmacy has a daily average wait time of 57 minutes. Not only does the long wait cause dissatisfaction and discomfort to patients, it may also be detrimental to those who are in urgent need of their prescriptions. The pharmacy decides to test a new procedure and a new staffing schedule with the goal of reducing the average wait time to a maximum of 40 minutes. The average wait time of the first 45 patients per day (subgroup size = 45) is calculated for 14 consecutive business days. The results show that the new operations can maintain a stable daily average wait time of under 40 minutes, but it is not capable as the distribution is left-skewed, and the Cpk and Ppk values are low.
