Trendable for Data Analysis
Orange Juice Volume
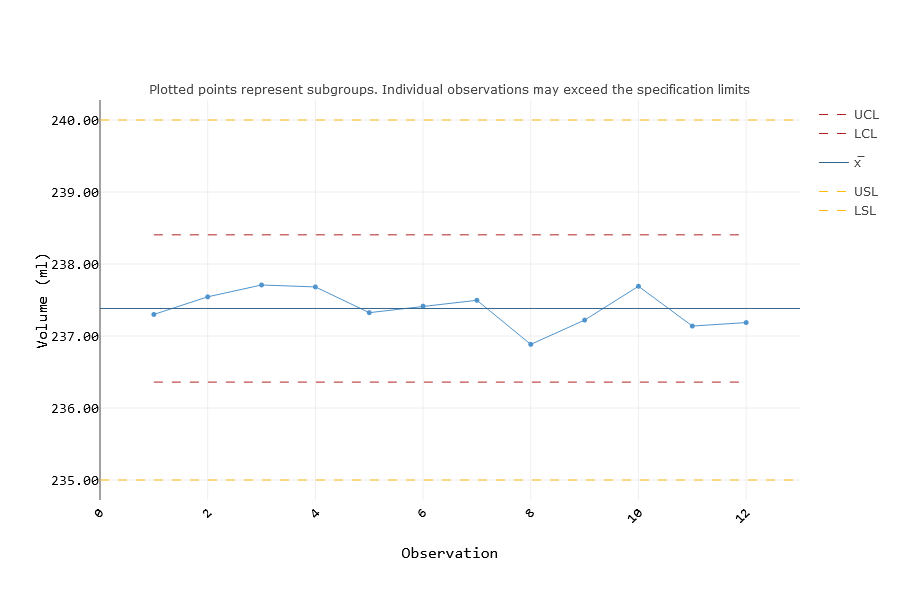
Control Chart

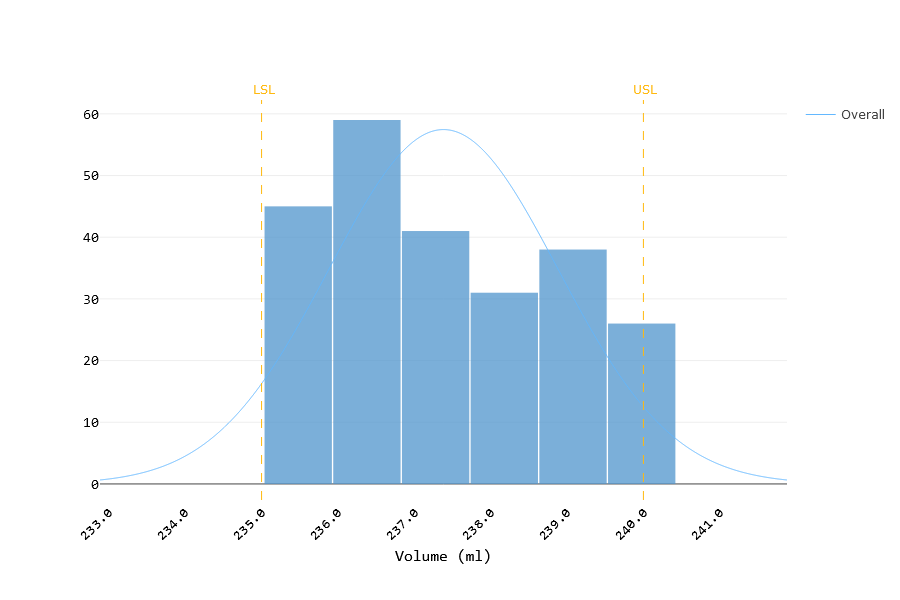
Capability Histogram

Data Scenario
A beverage company wants to see if all 12 of their machines can consistently fill an 8 fl oz (approx. 240 ml) bottle of orange juice with a volume between 235 ml and 240ml. From each machine, 20 bottles that were filled at the same time are sampled (subgroup size = 20). The X-Bar chart shows the machines are consistent in filling an average volume within the specification limits and control limits. However, there seems to be an increasing trend for every 3 consecutive machines. Since only 20 bottles from each machine were sampled in a large manufacturing facility, another test can be done with a larger subgroup size to help identify potential special causes of variation.
