Trendable for Data Analysis
Coffee Volume
Control Chart

Capability Histogram

Data Scenario
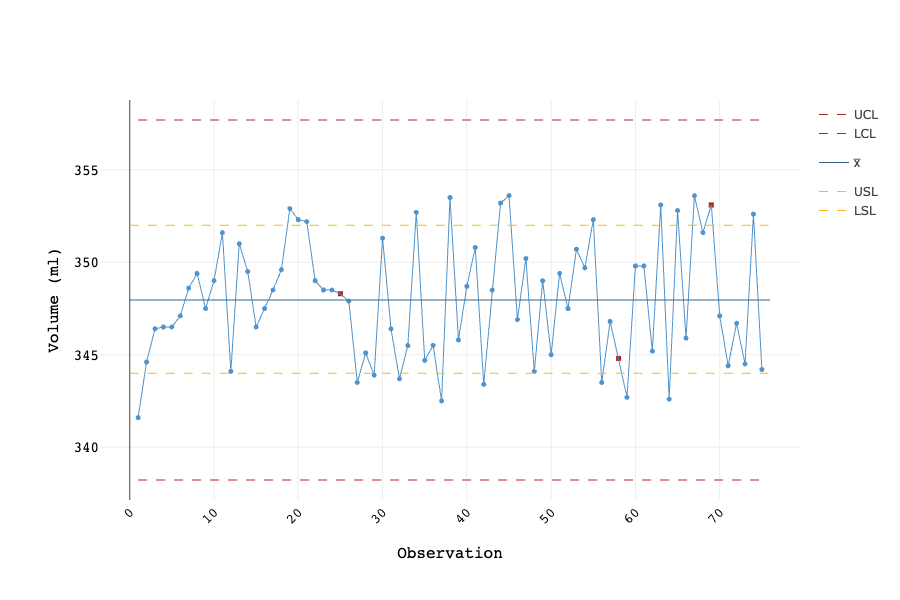
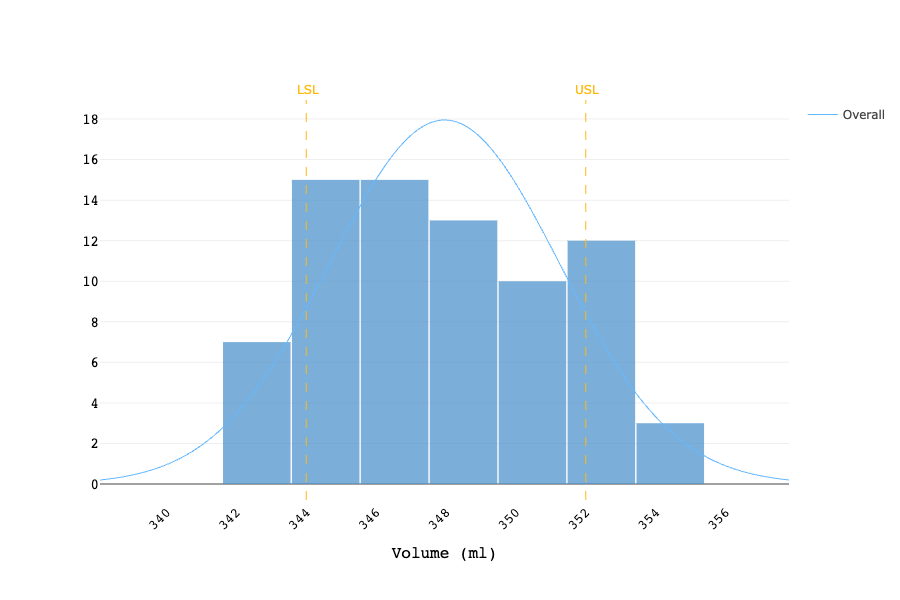
The standard medium-sized coffee cup is 12 oz or approximately 354 ml. A cafe wants to make sure that their automatic coffee machine will only pour between 344 ml to 352 ml of coffee at the press of the Medium button. Measuring the volumes of 75 trials, the cafe finds that their machine is inconsistent in pouring out the desired volume as there are several measurements that are either increasing or decreasing in a row, or consecutively alternating up and down. Since the chart shows multiple patterns instead of random plots, as well as plots exceeding the desired range, the process is deemed neither stable nor capable.
